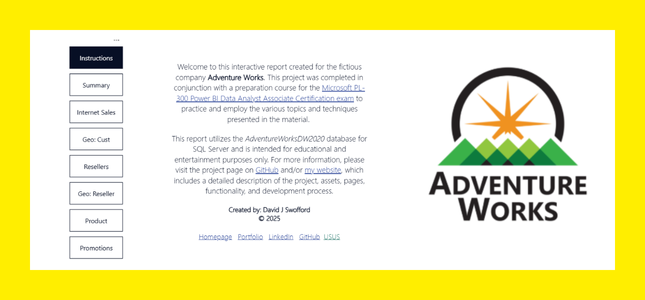
Sample data visualization project as part of professional portfolio demonstrating ETL, data modeling, and reporting skills using SQL Server & Microsoft Power BI.
Click here for the direct link to the report.
The following steps were taken to complete the project.
Preparation & Setup
- Database Environment
- MS SQL Server local instance
- SSMS installation & configuration
- Download database backup files (link)
- Restore database with backup files
- Power BI Configuration
- Confirm installation
- Connect to database
- Confirm data access & availability
- ETL Process
- Select Tables: (Dim) Product, Region, State & (Fact) Sales
- Review Colum quality, distribution, & profile
- Remove unnecessary columns
- Add Custom Columns to Sales (fact) table: Gross Revenue, Discount, Net Revenue, Days to Ship
- Transform data types & Configure formats
- Load (import mode) to PBI Data Model
- Data Modeling
- Create Star (Snowflake) Schema
- Create Relationships (diagram or list)
- Group Metrics & Measures into Display folders
- Do not mark OrderDate & ShipDate as Date Tables (implicit)
- Report Build
- Story flow
- Pages
- Visualization Groups
- Layout
- Funcitonality
- Navigation
- Slicers
- Interactions
- Cross-filtering
- Highlighting
- Fine-tuning
- Fonts & Colors
- Labels & spacing
- Images & Text
- Mobile Optimization
- Publishing
- Power BI Service
- Registration & Setup
- Permissions & Settings (Publish to Web)
- Embed Codes
- WordPress Site Integration

